Next to the 6/26 Geometric & Fed CIT & 6/27 Long term Geometric time CIT, we had a
267 CD Cycle: 5/20/15H-267- 2/11/16L-267- 11/4/16L-265- 7/27/17H/L
220 TD cycle: 9/12L=7/27
144 TD Inverse cycle: 12/30L= 7/27 19 wk/133 CD: 2/11/16L-137-6/27/16L-130-11/4/16L-131- 3/15/17H-134- 7/27/17H/L
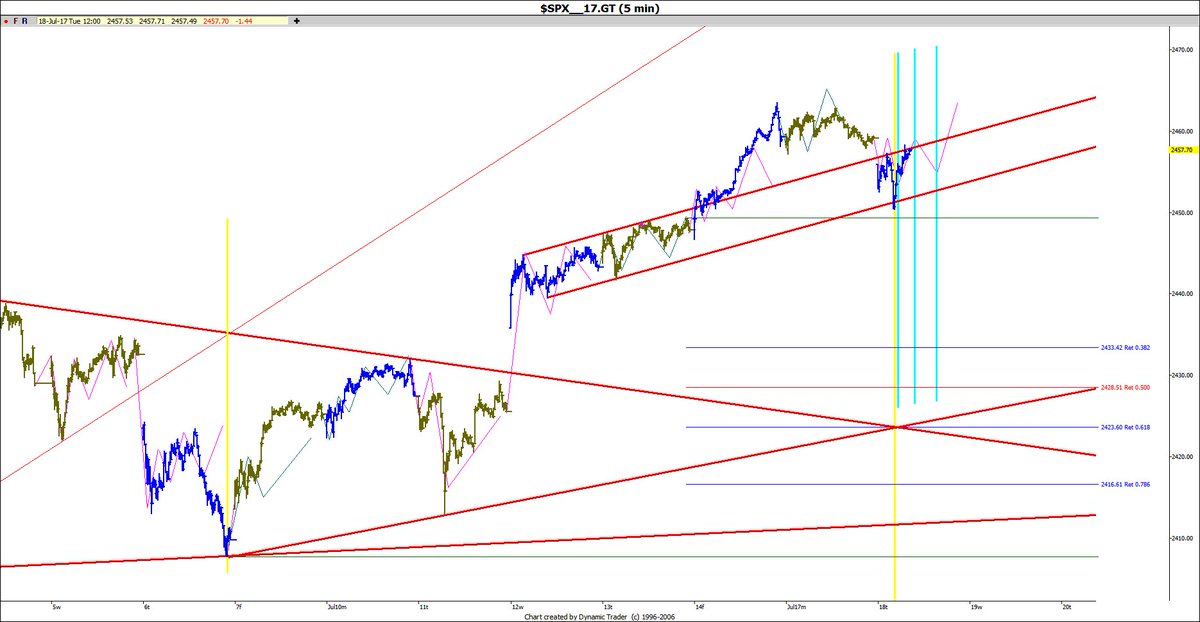
7/27 could be a High & Low. The markets needs to prove themselves first by declining below 2459.93 SPX to confirm a 7/27H was in.
267 CD Cycle: 5/20/15H-267- 2/11/16L-267- 11/4/16L-265- 7/27/17H/L
220 TD cycle: 9/12L=7/27
144 TD Inverse cycle: 12/30L= 7/27 19 wk/133 CD: 2/11/16L-137-6/27/16L-130-11/4/16L-131- 3/15/17H-134- 7/27/17H/L
7/27 could be a High & Low. The markets needs to prove themselves first by declining below 2459.93 SPX to confirm a 7/27H was in.